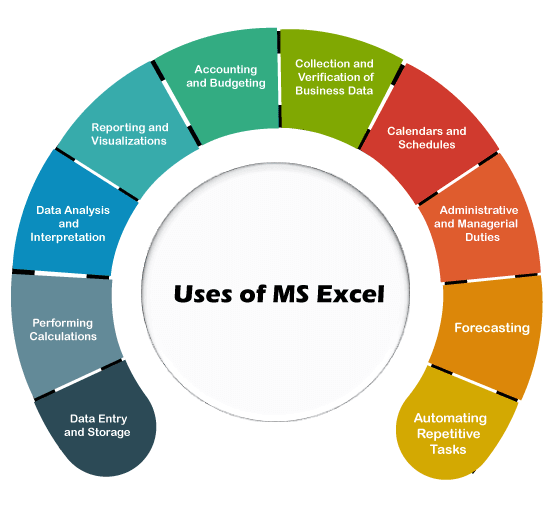
Data analysis in Excel refers to the process of analyzing and manipulating data using the various tools and features available in Microsoft Excel. Excel is a popular spreadsheet software that offers a wide range of data analysis capabilities, including data cleaning, data transformation, statistical analysis, data visualization, and data modeling.
Some common data analysis tasks that can be performed in Excel include:
- Data Cleaning
Excel can be used to clean and prepare data for analysis by removing duplicates, correcting errors, and filling in missing values. - Data Transformation
Excel can be used to transform data by combining data from multiple sources, splitting data into separate columns, or pivoting data to summarize and analyze it in a different way. - Statistical Analysis
Excel offers a range of statistical functions and tools that can be used to analyze data, such as calculating averages, standard deviations, and correlation coefficients. - Data Visualization
Excel can be used to create charts, graphs, and other visualizations that help to communicate data insights and trends. - Data Modeling
Excel can be used to create data models, such as financial models or predictive models, that help to forecast future outcomes or make data-driven decisions.
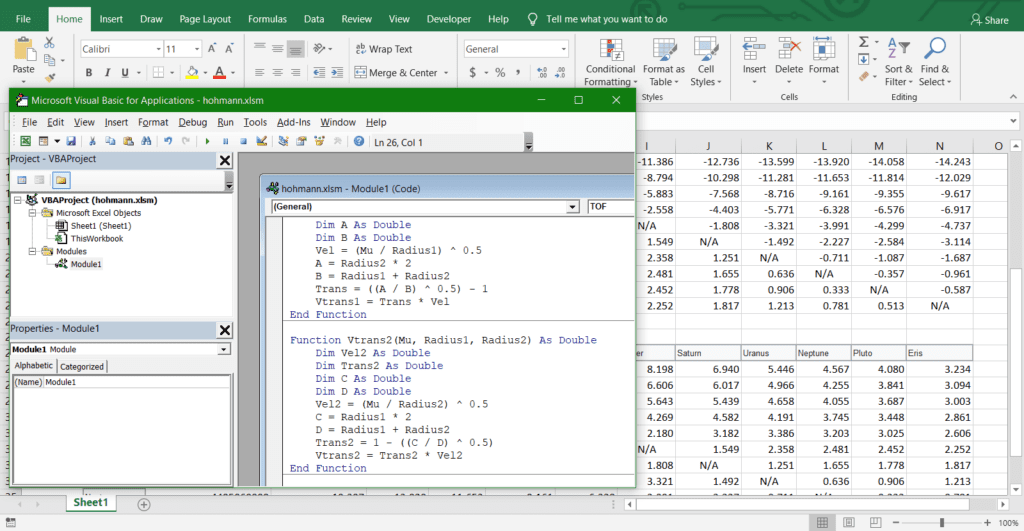
To perform data analysis in Excel, users can use various features such as formulas, functions, pivot tables, data validation, and conditional formatting. Excel also offers add-ons and plugins, such as Power Query and Power Pivot, that can extend its data analysis capabilities.
NOTE:
Data analysis in Excel is widely used in various industries, including finance, marketing, sales, and operations. It is a valuable skill for professionals who need to analyze and interpret data in their work, and can help to inform decision-making and drive business results.
About Author
Discover more from SURFCLOUD TECHNOLOGY
Subscribe to get the latest posts sent to your email.