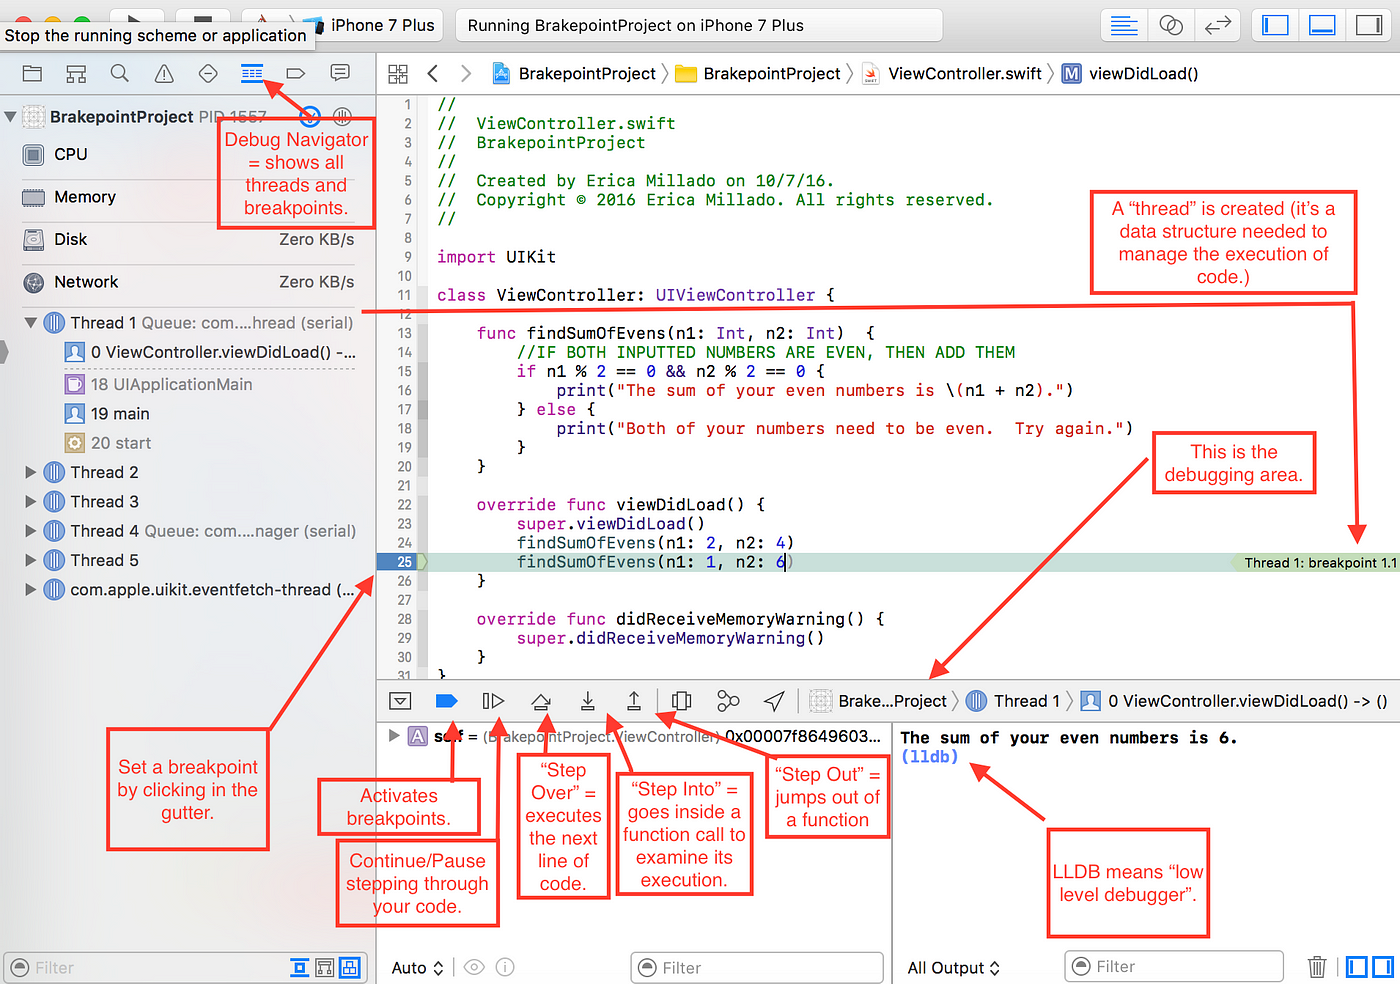
Once you have set a breakpoint, you can continue debugging by following these steps:
1. Click on the “Debug” button in the top menu bar. This will start the debugger and pause the execution of your code at the first breakpoint.
2. Click on the “Step” button in the top menu bar. This will execute the next line of code and then pause the execution of your code.
3. Inspect the values of variables by hovering over the variable name in the code editor. The value and the result would be displayed as required in the toolkit as expected by the user.
4. Continue debugging by clicking on the “Continue” button in the top menu bar. This will continue the execution of your code until the next breakpoint is reached.
5. Repeat steps 2-4 until you have finished debugging your code.
6. Click on the “Stop” button in the top menu bar to stop debugging and return to the code editor. The above or the aforementioned clarified the precise commands.
About Author
Discover more from SURFCLOUD TECHNOLOGY
Subscribe to get the latest posts sent to your email.


