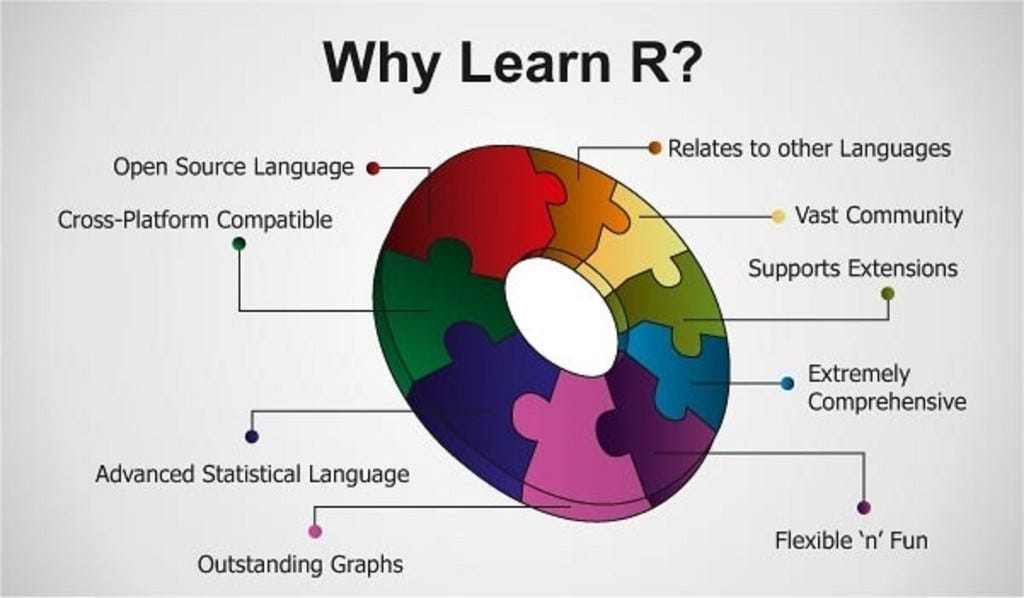
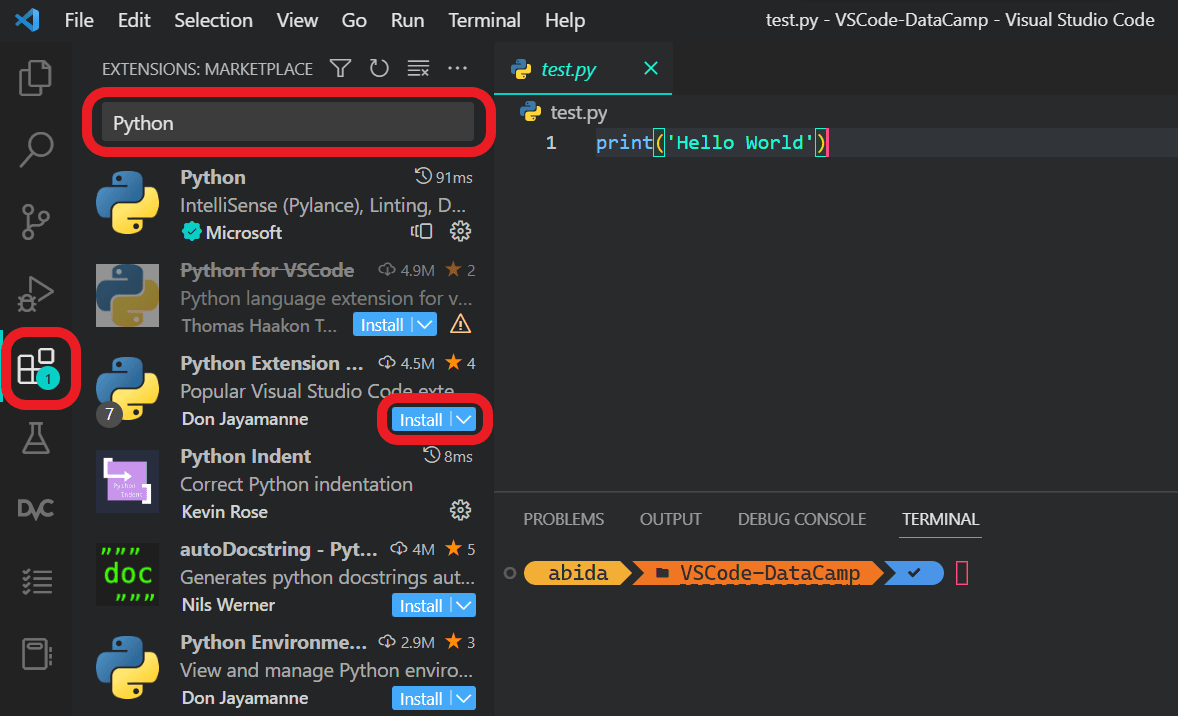
R programming is said to be a strong and powerful language that helps most and many users in the field of data sciences and, above all, statistical procedural features and tasks.
However, it is mainly considered the most powerful statistical computing language that is widely used for data analysis, as said above, and also for visualization.
Consider the below code:
Generate some random data
data <- rnorm(100)
# Calculate the mean and standard deviation
mean_data <- mean(data)
sd_data <- sd(data)
Create a histogram of the data
hist(data)
# Calculate a confidence interval for the mean
conf_int <- t.test(data)$conf.int
Print the results
cat(“Mean: “, mean_data, “\n”,
“Standard Deviation: “, sd_data, “\n”,
“Confidence Interval: “, conf_int, “\n”)
The above code generates some random data, calculates its mean and standard deviation, creates a histogram of the data, and, however, calculates a confidence interval for the mean.
However, it gives an output or results to the console. In addition, R programming is known for its powerful data manipulation and management, visualization capabilities, and extensive library of statistical packages.
Precisely, it is a popular choice for data scientists, statisticians, and even researchers in many known fields.
About Author
Discover more from SURFCLOUD TECHNOLOGY
Subscribe to get the latest posts sent to your email.


